SymphonyTech
ProMSA is a Comprehensive Software for Measurement Systems Analysis (MSA) compliant with AIAG MSA Manual – 4th Edition.
Find out how ProMSA greatly simplifies the tedious MSA activities in your organization, while delivering all the power of complex statistics needed to comply with the AIAG standards.
Customers Worldwide
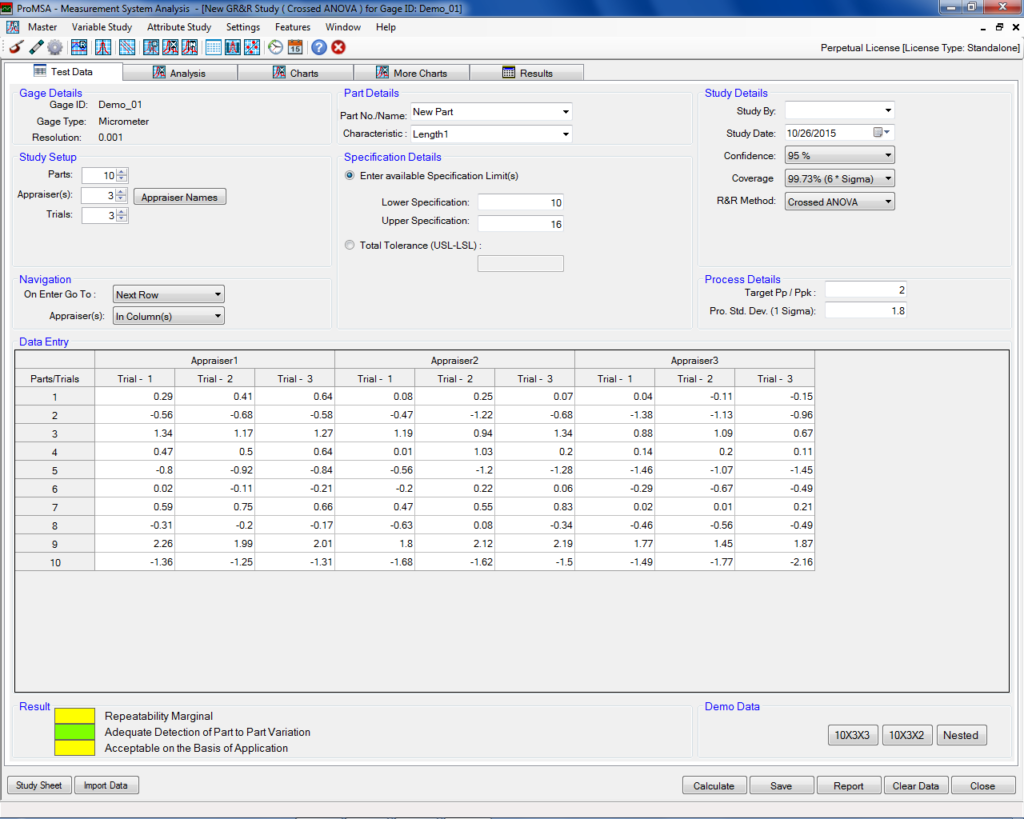
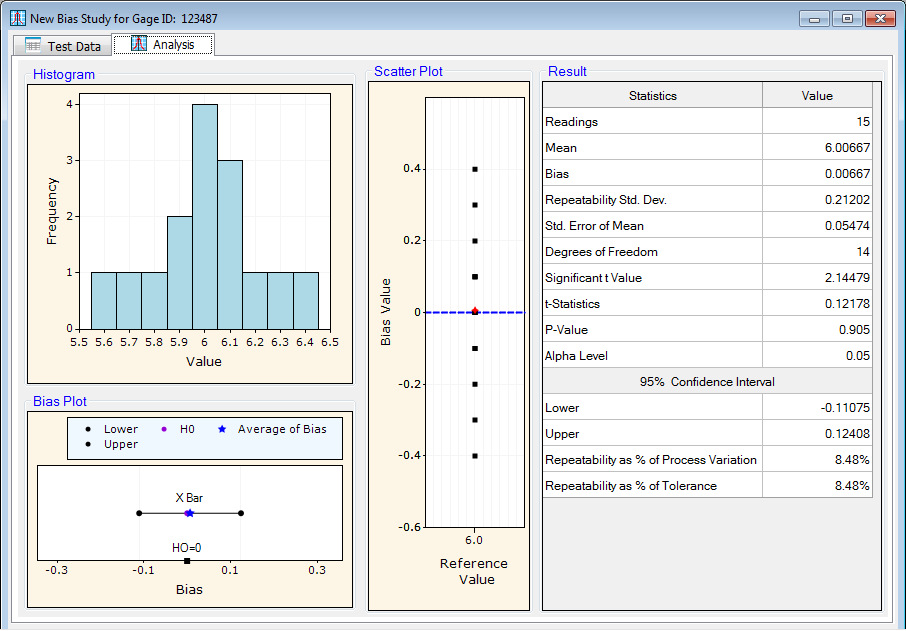
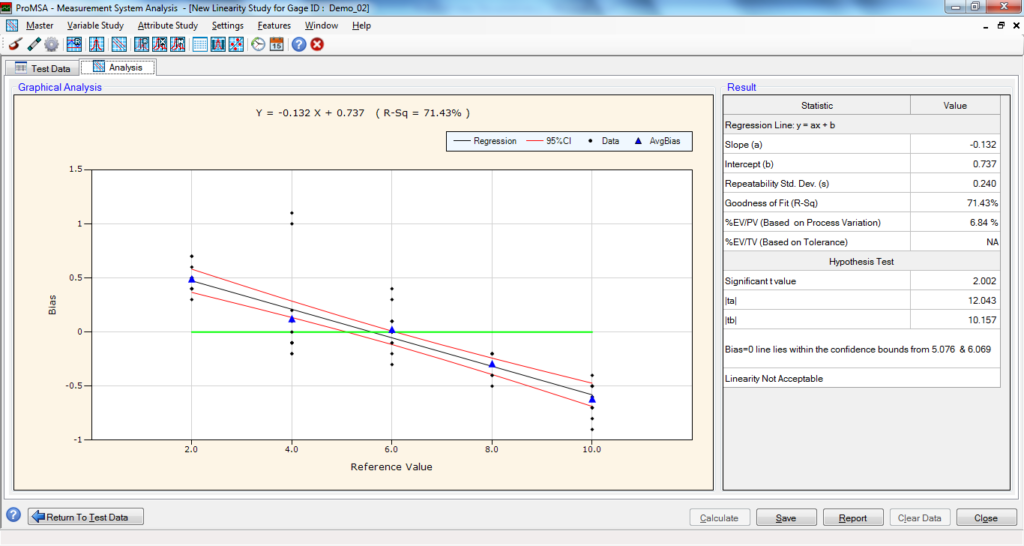
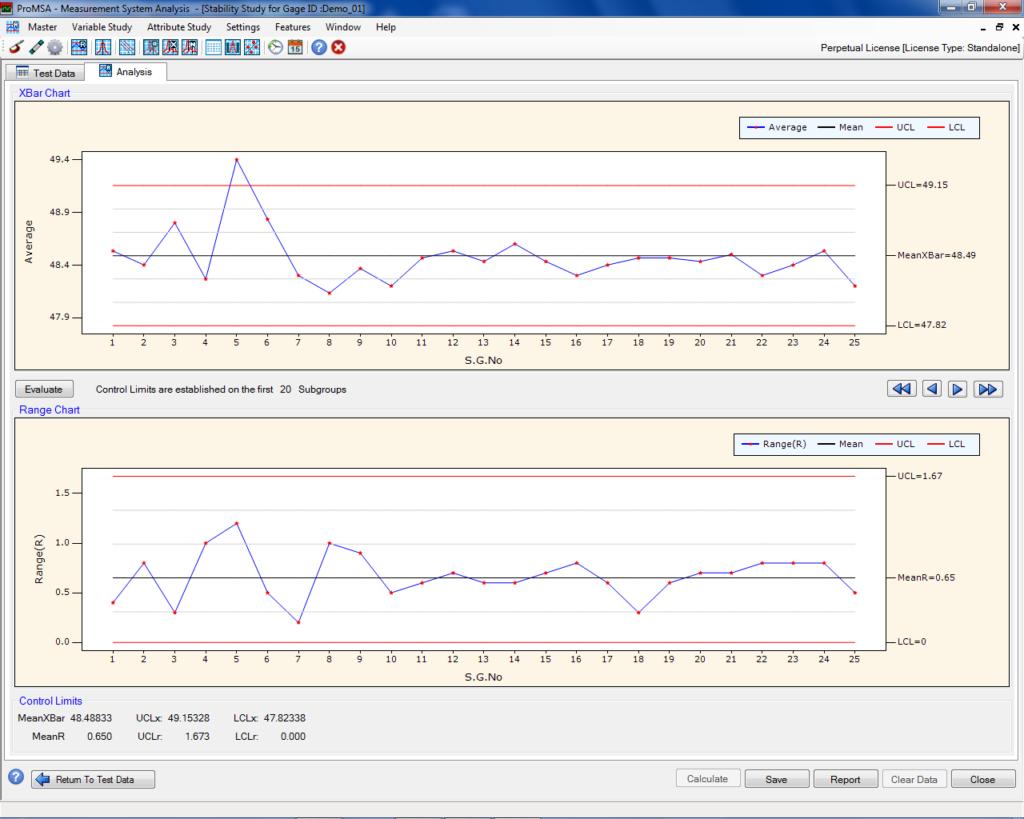
Variable Studies:
R&R Study using 3 methods:
Facility for Variable number of Samples, Trials and Appraisers in an easy, user-friendly interface with free-form copy & paste
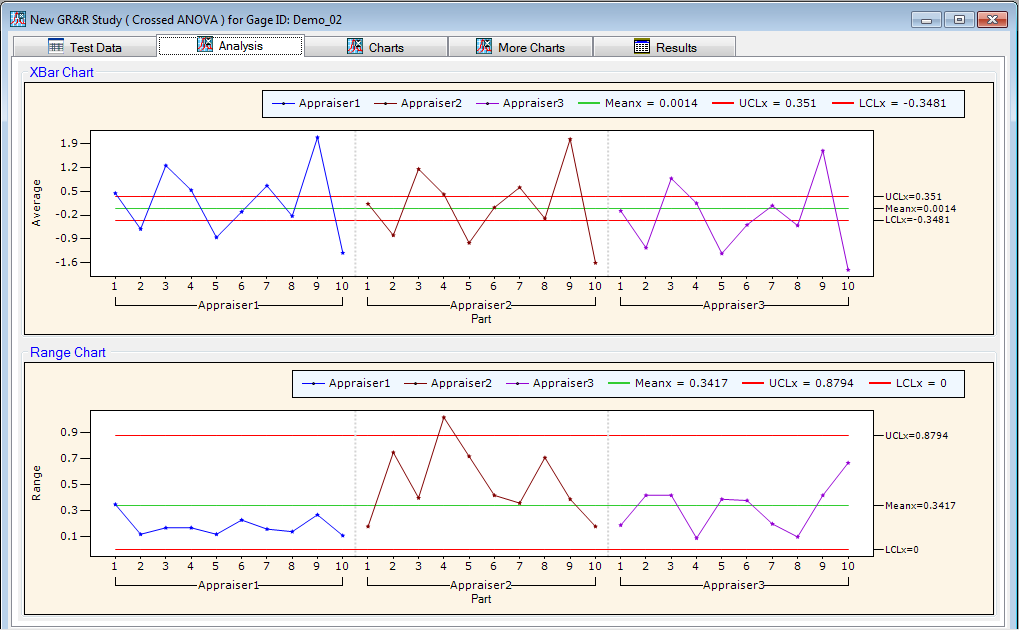
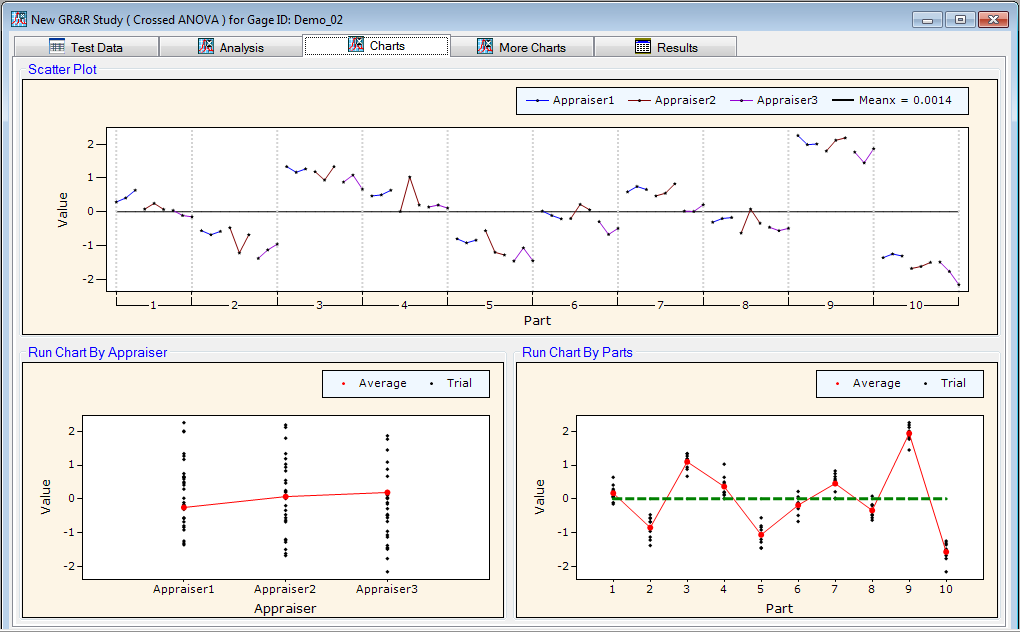
Advanced Control Chart analysis:
Traffic signals for
Computation of
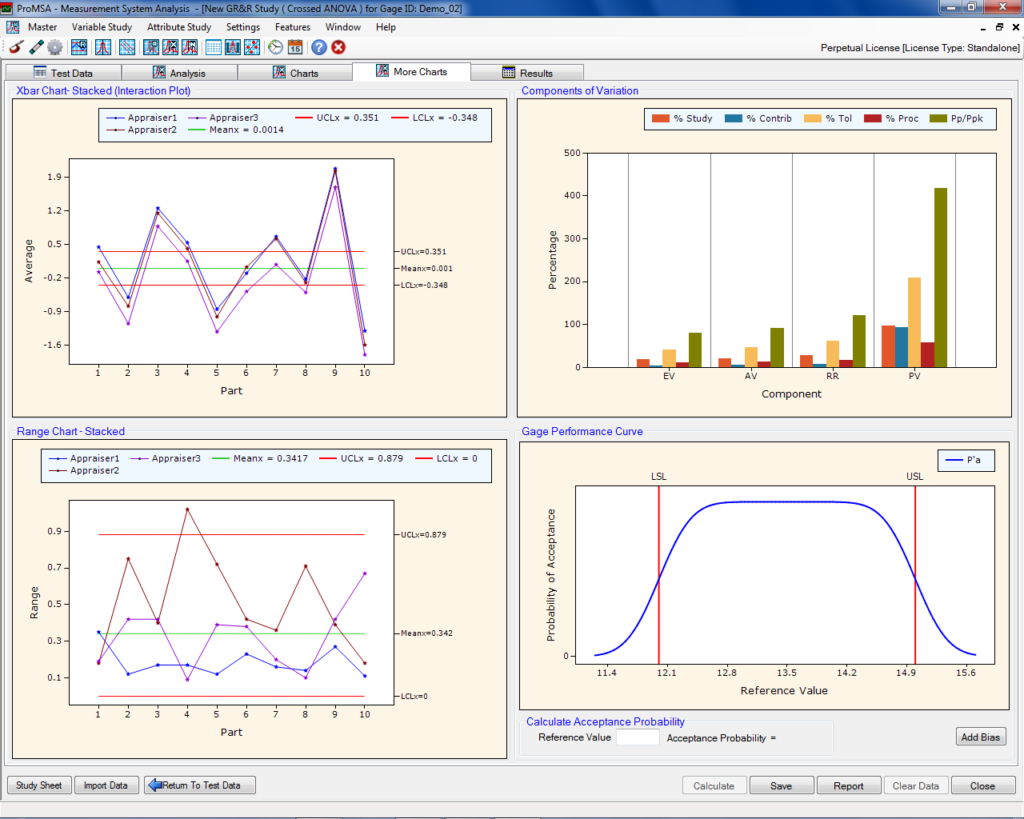
Reports on % of AV, EV and PV expressed on the basis of Study Variation, Process Variation, Tolerance & Target Ppk
Also See :